109669
论文已发表
注册即可获取德孚的最新动态
IF 收录期刊
- 3.4 Breast Cancer (Dove Med Press)
- 3.2 Clin Epidemiol
- 2.6 Cancer Manag Res
- 2.9 Infect Drug Resist
- 3.7 Clin Interv Aging
- 5.1 Drug Des Dev Ther
- 3.1 Int J Chronic Obstr
- 6.6 Int J Nanomed
- 2.6 Int J Women's Health
- 2.9 Neuropsych Dis Treat
- 2.8 OncoTargets Ther
- 2.0 Patient Prefer Adher
- 2.2 Ther Clin Risk Manag
- 2.5 J Pain Res
- 3.0 Diabet Metab Synd Ob
- 3.2 Psychol Res Behav Ma
- 3.4 Nat Sci Sleep
- 1.8 Pharmgenomics Pers Med
- 2.0 Risk Manag Healthc Policy
- 4.1 J Inflamm Res
- 2.0 Int J Gen Med
- 3.4 J Hepatocell Carcinoma
- 3.0 J Asthma Allergy
- 2.2 Clin Cosmet Investig Dermatol
- 2.4 J Multidiscip Healthc

对接受 nCPAP (鼻持续气道正压) 治疗中表现出较差依从性的成人 OSAS (阻塞性睡眠呼吸暂停综合征) 患者进行治疗前和治疗中预测评分的模型
Authors Wang Y, Geater AF, Chai Y, Luo J, Niu X, Hai B, Qin J, Li Y
Published Date May 2015 Volume 2015:9 Pages 715—723
DOI http://dx.doi.org/10.2147/PPA.S83105
Received 18 February 2015, Accepted 18 March 2015, Published 28 May 2015
Objectives: To identify patterns of adherence to nasal
continuous positive airway pressure (nCPAP) use in the first 3 months of
therapy among newly diagnosed adult patients with obstructive sleep
apnea/hypopnea syndrome (OSAS) and their predictors. To develop pretherapy and
in-therapy scores to predict adherence pattern.
Methods: Newly diagnosed adult
OSAS patients were consecutively recruited from March to August 2013. Baseline
clinical information and measures such as Epworth Sleepiness Scale (ESS),
Fatigue Severity Scale (FSS), Zung’s Self-Rating Depression Scale (SDS), and
The Pittsburgh Sleep Quality Index (PSQI) at baseline and at the end of
3rd-week therapy were collected. Twelve weeks’ adherence data were collected
from the nCPAP memory card, and K-means cluster analysis was used to explore
adherence patterns. Predictive scores were developed from the coefficients of
cumulative logit models of adherence patterns using variables available at
baseline and after 3 weeks of therapy. Performance of the score was validated
using 500 bootstrap resamples.
Results: Seventy six patients
completed a 12-week follow-up. Three patterns were revealed. Patients were
identified as developing an adherence pattern that was poor (n=14, mean ± SD,
2.3±0.9 hours per night), moderate (n=19, 5.3±0.6 hours per night), or good
(n=43, 6.8±0.3 hours per night). Cumulative logit regression models (good → moderate → poor) revealed independent baseline predictors to be ESS
(per unit increase) (OR [95% CI], 0.763 [0.651, 0.893]), SDS (1.461 [1.238,
1.724]), and PSQI (2.261 [1.427, 3.584]); and 3-week therapy predictors to be
ESS (0.554 [0.331, 0.926]), PSQI (2.548 [1.454, 4.465]), and the changes (3rd
week–baseline data) in ESS (0.459 [0.243, 0.868]), FSS (3.556 [1.788, 7.070]),
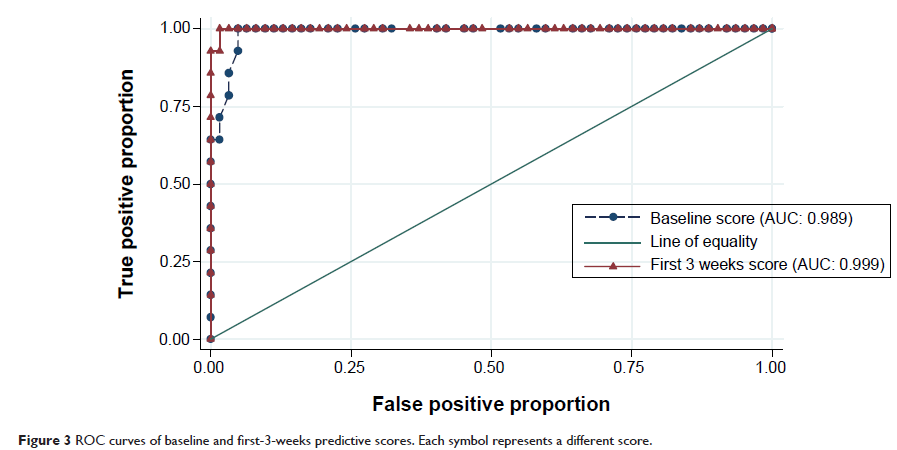
and PSQI (2.937 [1.273, 6.773]). Two predictive score formulas for poor
adherence were developed. The area under the curve (AUC) of the receiver
operating characteristics (ROC) curves for baseline and 3-week formulas were
0.989 and 0.999, respectively. Bootstrap analysis indicated positive predictive
values of baseline and 3-week predictive scores in our patient population of
0.82 (95% CI [0.82, 0.83]) and 0.94 (95% CI [0.93, 0.94]), respectively.
Conclusion: A high level of
prediction of poor adherence pattern is possible both before and at the first 3
weeks of therapy. The predictive scores should be further evaluated for
external validity.
Keywords: OSAS, adherence,
nCPAP, predictive model, K-means cluster analysis, bootstrap analysis
